Mill Models
Physics Models for Steel Operations
Operations models are designed to give steel operations and research leaders a digital environment to explore how mills, products, and process limits interact — offline, without touching production.
In development: a hot strip mill finishing-mill model is being implemented now
What Is an Operations Model?
First-Principles Physics, Built for Decisions
An operations model is a first-principles physics model of a production unit, built and tuned for your mill's equipment, products, and data.
Optimizing production
Find what limits throughput for each product and test changes offline before they reach the floor.
R&D and quality analysis
Explore how grades, gauges, and temperatures interact with the limits of your equipment.
Engineering and leadership decisions
Give engineers and managers one physics-based view of what the mill can do.
The Mill Model Family
Models by Production Unit
Models are grouped by the production unit they serve. Each one is built and tuned for the specific line it will describe.
Hot Strip Mill
- CapabilityIn development
- ProductivityIn development
- EfficiencyEarly development
- Pacing In development
- Finishing MillIn development
- CoilingPlanned
- FurnacePlanned
Cold Mill
- CapabilityEarly development
- ProductivityIn development
- SetupIn development
Every operations model is built and tuned for a specific mill. Ask us which models fit your line and where development stands.
Cold Mill Models
A Cold Rolling Mill Model Library
Our cold mill models share one set of physics, units, and interfaces, so setup, shape, and productivity studies all build on the same roll bite calculations. The models are verified against analytical solutions and have been validated against plant data from about ten plants.
Roll bite
Roll force, torque, and forward slip with roll flattening and elastic entry and exit zones, plus a non-circular arc model for thin hard strip, last stands, and temper rolling.
Model adaptation
Inverse models that back-calculate flow stress — and flow stress with friction — from measured roll force and forward slip.
Tandem mill setup
Stand reductions and interstand tensions that balance motor loads within force, unit force, and torque limits, with sheet and tin rolling modes.
Strip shape and flatness
Roll stack deflection with strip profile and flatness for 4-high and 6-high stands, including work and intermediate roll bending, roll shifting, and CVC rolls.
Roll thermal crown
Transient roll temperature and thermal crown, including heat exchange between rolls in the stack, feeding the shape model.
Productivity
Throughput for batch tandem, reversing, and continuous tandem mills, including weld slowdowns and entry section and accumulator limits.
Inside the Application
The Throughput Analysis Application
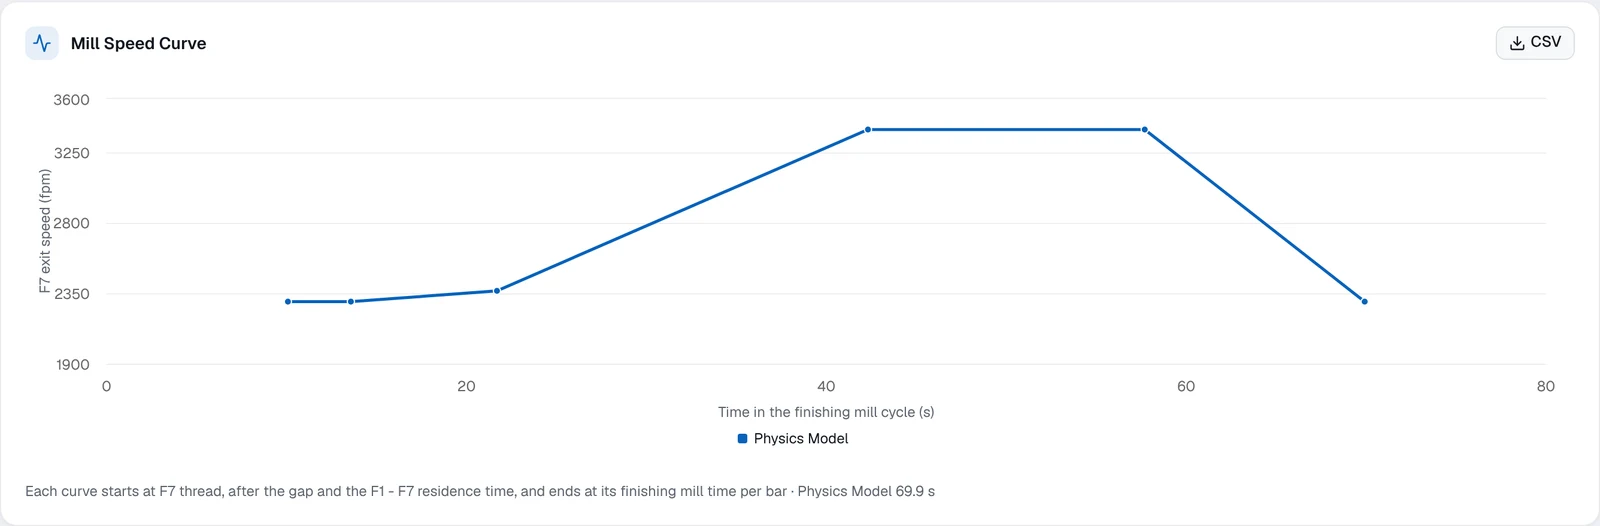
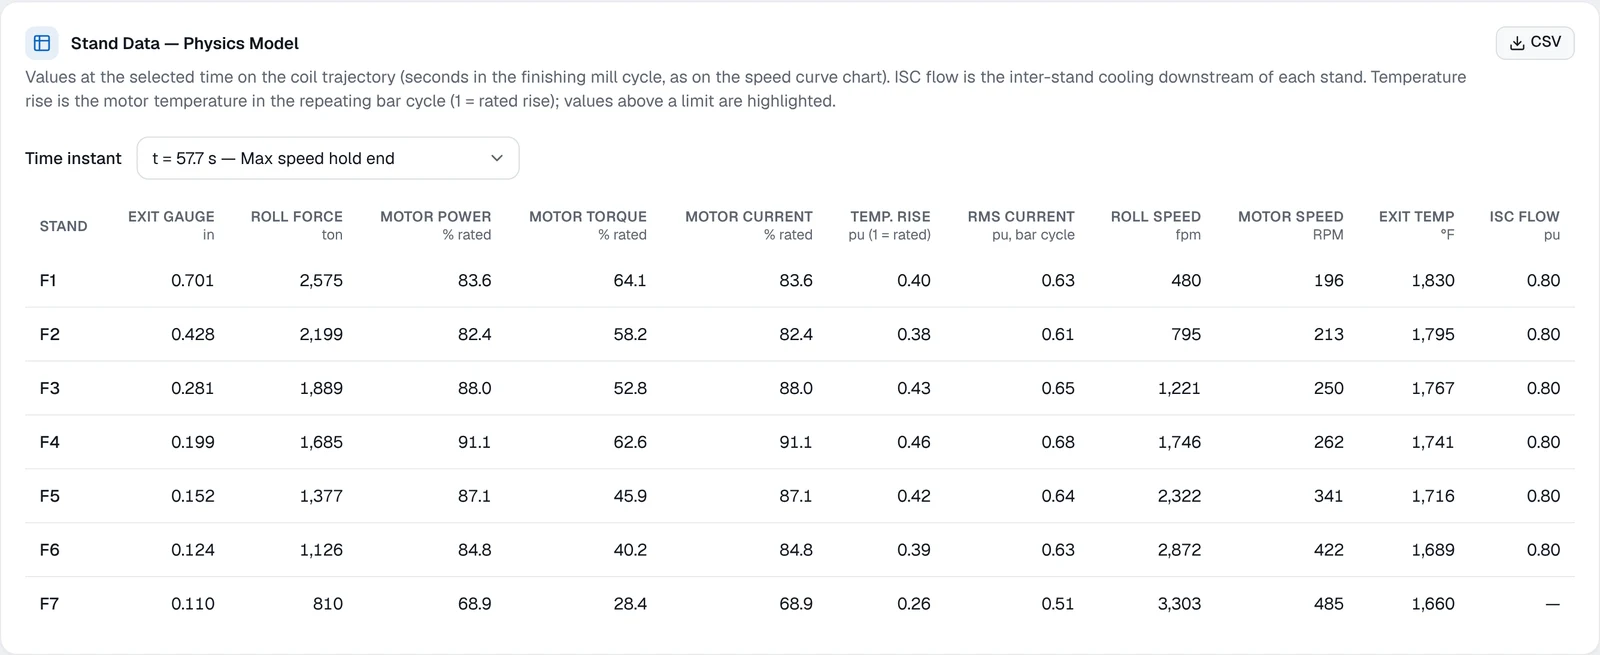
Screenshots from the Mill Models throughput analysis for a hot strip mill, run on a synthetic example mill and product. Single-bar mode follows one bar through the finishing mill; range mode sweeps exit thickness to find peak throughput and the bottleneck at each gauge.
Single-bar mode
One product at one finishing gauge: throughput, the limiting area of the mill, the finishing mill speed curve, and stand-by-stand loads.

Range mode
A sweep across finishing exit thickness: peak throughput, where it occurs, and which area of the mill limits each gauge.

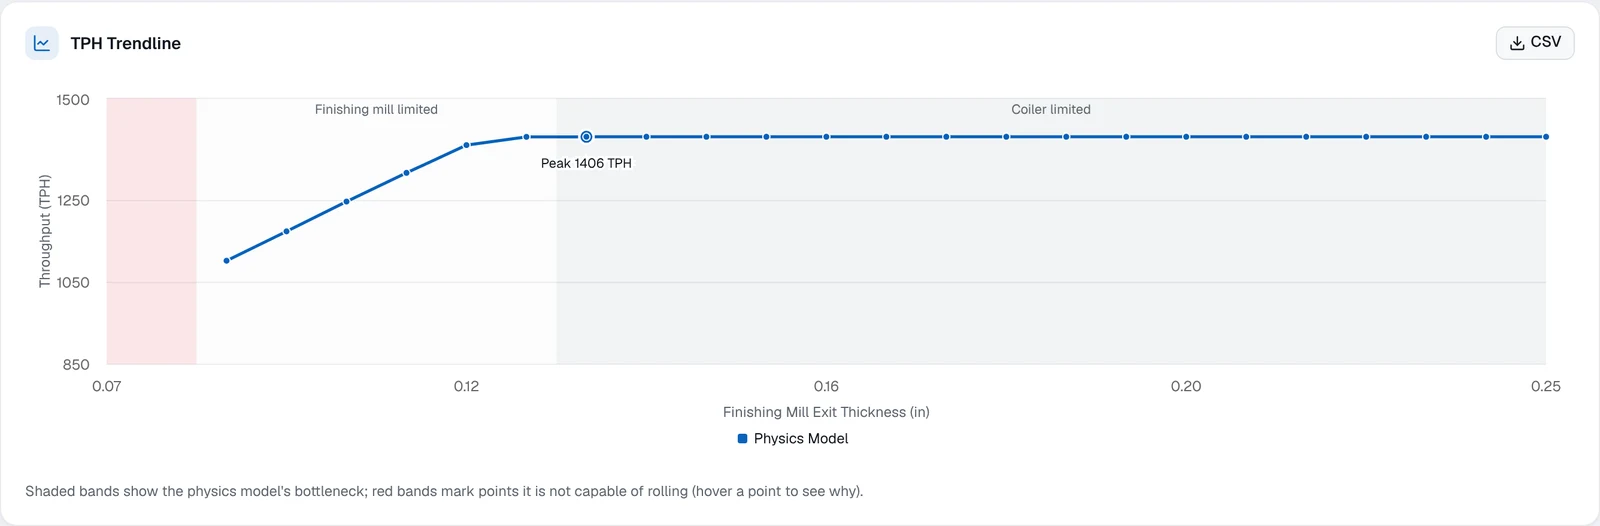
Screenshots from the in-development application on a synthetic example mill and product, not a customer's equipment or data. Results depend on each mill's equipment, products, and practices and are not a performance guarantee.
A Different Kind of Model
Operations Models vs. Traditional Setup Models
Setup models run the mill. Operations models are built to study it.
Operations models
- Built for offline analysis
- Made for operations, R&D, and engineering teams
- High-volume capability and throughput testing
- Throughput estimates by product, gauge, and temperature
Traditional setup models
- Built for online Level 1 / Level 2 production control
- Process one or two products at a time
- Few operations or capability features
- Can't be slowed down by extra analysis functions
What It's Built For
Questions Operations Models Are Built to Answer
Where is the bottleneck?
The finishing-mill model now in development is built to show whether the finishing mill, furnace pace, or coiler pace limits tons per hour for a given slab, grade, and target gauge — with predicted stand-by-stand roll force, roll speed, and motor load.
What if we change the product?
Designed to sweep exit gauge or entry temperature and show how predicted tons per hour change — offline, without touching production.
Which furnace option makes more tons?
Forecast tonnage for reheat furnace options using your mill's own historical product mix. We have used residence-time modeling to compare walking beam furnaces with a mill's existing furnaces.
How do the hot and cold mills work together?
Offered as a studyOffered as an engineering study, not yet delivered for a mill: model a finishing mill and a tandem cold mill as one continuous unit to explore how hot-band gauge affects cold mill production and look for the gauge that maximizes combined tonnage.
How many tons will this turn make?
Bar-by-bar tonnage forecasts that show the limiting area for each bar, with predicted and actual tons side by side. We have built and maintained one for a hot strip mill.
What about the whole production chain?
RoadmapLinking unit models across a chain — such as hot strip mill, pickle line, and cold mill — to evaluate total output is a future direction on our roadmap, not a current offering.
Featured Model
Furnace Pacing Model
A math model designed to set furnace pace on furnace-limited products, with configurable settings for bar temperature control and production when the furnace is the limit.
In development: each model is tuned for your furnaces, then run side by side with your existing system before commissioning.
Design goals
More tons on furnace-limited products
Fewer cobbles
Less operator error
More consistent bar temperatures
What it is designed to provide
- A math model designed to set pace on furnace-limited products
- Configuration settings for controlling bar temperature and maximizing production when the furnace is the limit
- Time- and bar-based logging with summary reporting
Our furnace pacing experience
We have done furnace pacing control work on site at an integrated steel producer's hot strip mill, including:
- Closed-loop pacing control with improved pacing feedback
- Pace targets set by heating practice, using Level 1 tracking data
- Adaptive hold times that recover travel time lost between the furnace and the scale breaker
- Time-loss analysis with new historian signals
- Early development of a dynamic pacing model that calculates an ideal pace setpoint for each bar
Model interaction & capability
The pacing model is designed to work with a heat model and a production model. Closed-loop mode adds feedback, and the thermal modes add the heat and production models.
Pacing Model
Sets furnace pace
Heat Model
Adds thermal prediction
Production Model
Adds production forecasting
| Mode | Pacing | Heat | Production |
|---|---|---|---|
| Open LoopPacing math model | – | – | |
| Closed LoopPacing plus feedback | – | – | |
| ThermalHeat plus pacing model | – | ||
| Thermal ForecastPacing, heat, and production models |
Layering models is designed to enable
Configuration tuning
- Furnace pace settings
- Temperature targets and tolerances
- Operating mode by bar: soak, time, or heat mode
Designed for real-world teams
- Easy-to-use tools and configuration
- Designed to reduce reliance on process specialists and programming expertise
- Notification of program and process changes
- Designed so your team keeps change control in-house
Deployment
Fits Your Plant and Your Systems
Designed to run where you need it
- Designed to run entirely on premise — cloud compute is not required
- Optional on-premise and cloud hybrid
Designed to connect to your tools
- Model functions designed for access from Excel, SQL, and JSON REST APIs
- Example technology options, scoped per project: .NET web applications, Ignition, and Logix controllers
Controlled change
- Staged change control
- Approval chain
- Change windows scheduled by authorized personnel
How a Project Runs
From Onsite Review to Go-Live
01
Onsite Review
Engineers come on site to review the existing system and gather engineering data and requirements.
02
Functional Engineering
A living document that describes the system in detail.
03
Review
Review the functional description together and fine-tune the details.
04
Run
Develop the math models, system interfaces, and final documentation.
05
Shadow
Run side by side and validate against the real-world system.
06
Commission
Go live.
Getting Started
Three Steps to a Model Built for Your Mill
1. Mill Assessment
An on-site preliminary engineering study of your line.
- Product mix and equipment limits: motors, gear reducers, and drives
- Line geometry and thermal capability: furnace distances, zones, and heating and cooling power
- An initial model tuned to your operating data
- A data-driven evaluation report with recommendations
2. Model Development
We develop and tune the models for your production unit.
- Functional engineering reviewed with your team
- Math models, system interfaces, and documentation
- Shadow validation against the real mill before go-live
3. Production Tools
Put the model to work for operations, engineering, and R&D.
- Dashboards
- System interfaces
- HMI screens
- Security
Explore What Your Mill Can Do
Tell us about your production unit and the decisions in front of you. We'll tell you where an operations model can help — and where it can't.